STEM Module Sample: Air Pollution Data Crawling in Hong Kong
This module is intended for students to quickly learn how to crawl a table on some of the more popular web sites.
Experience First
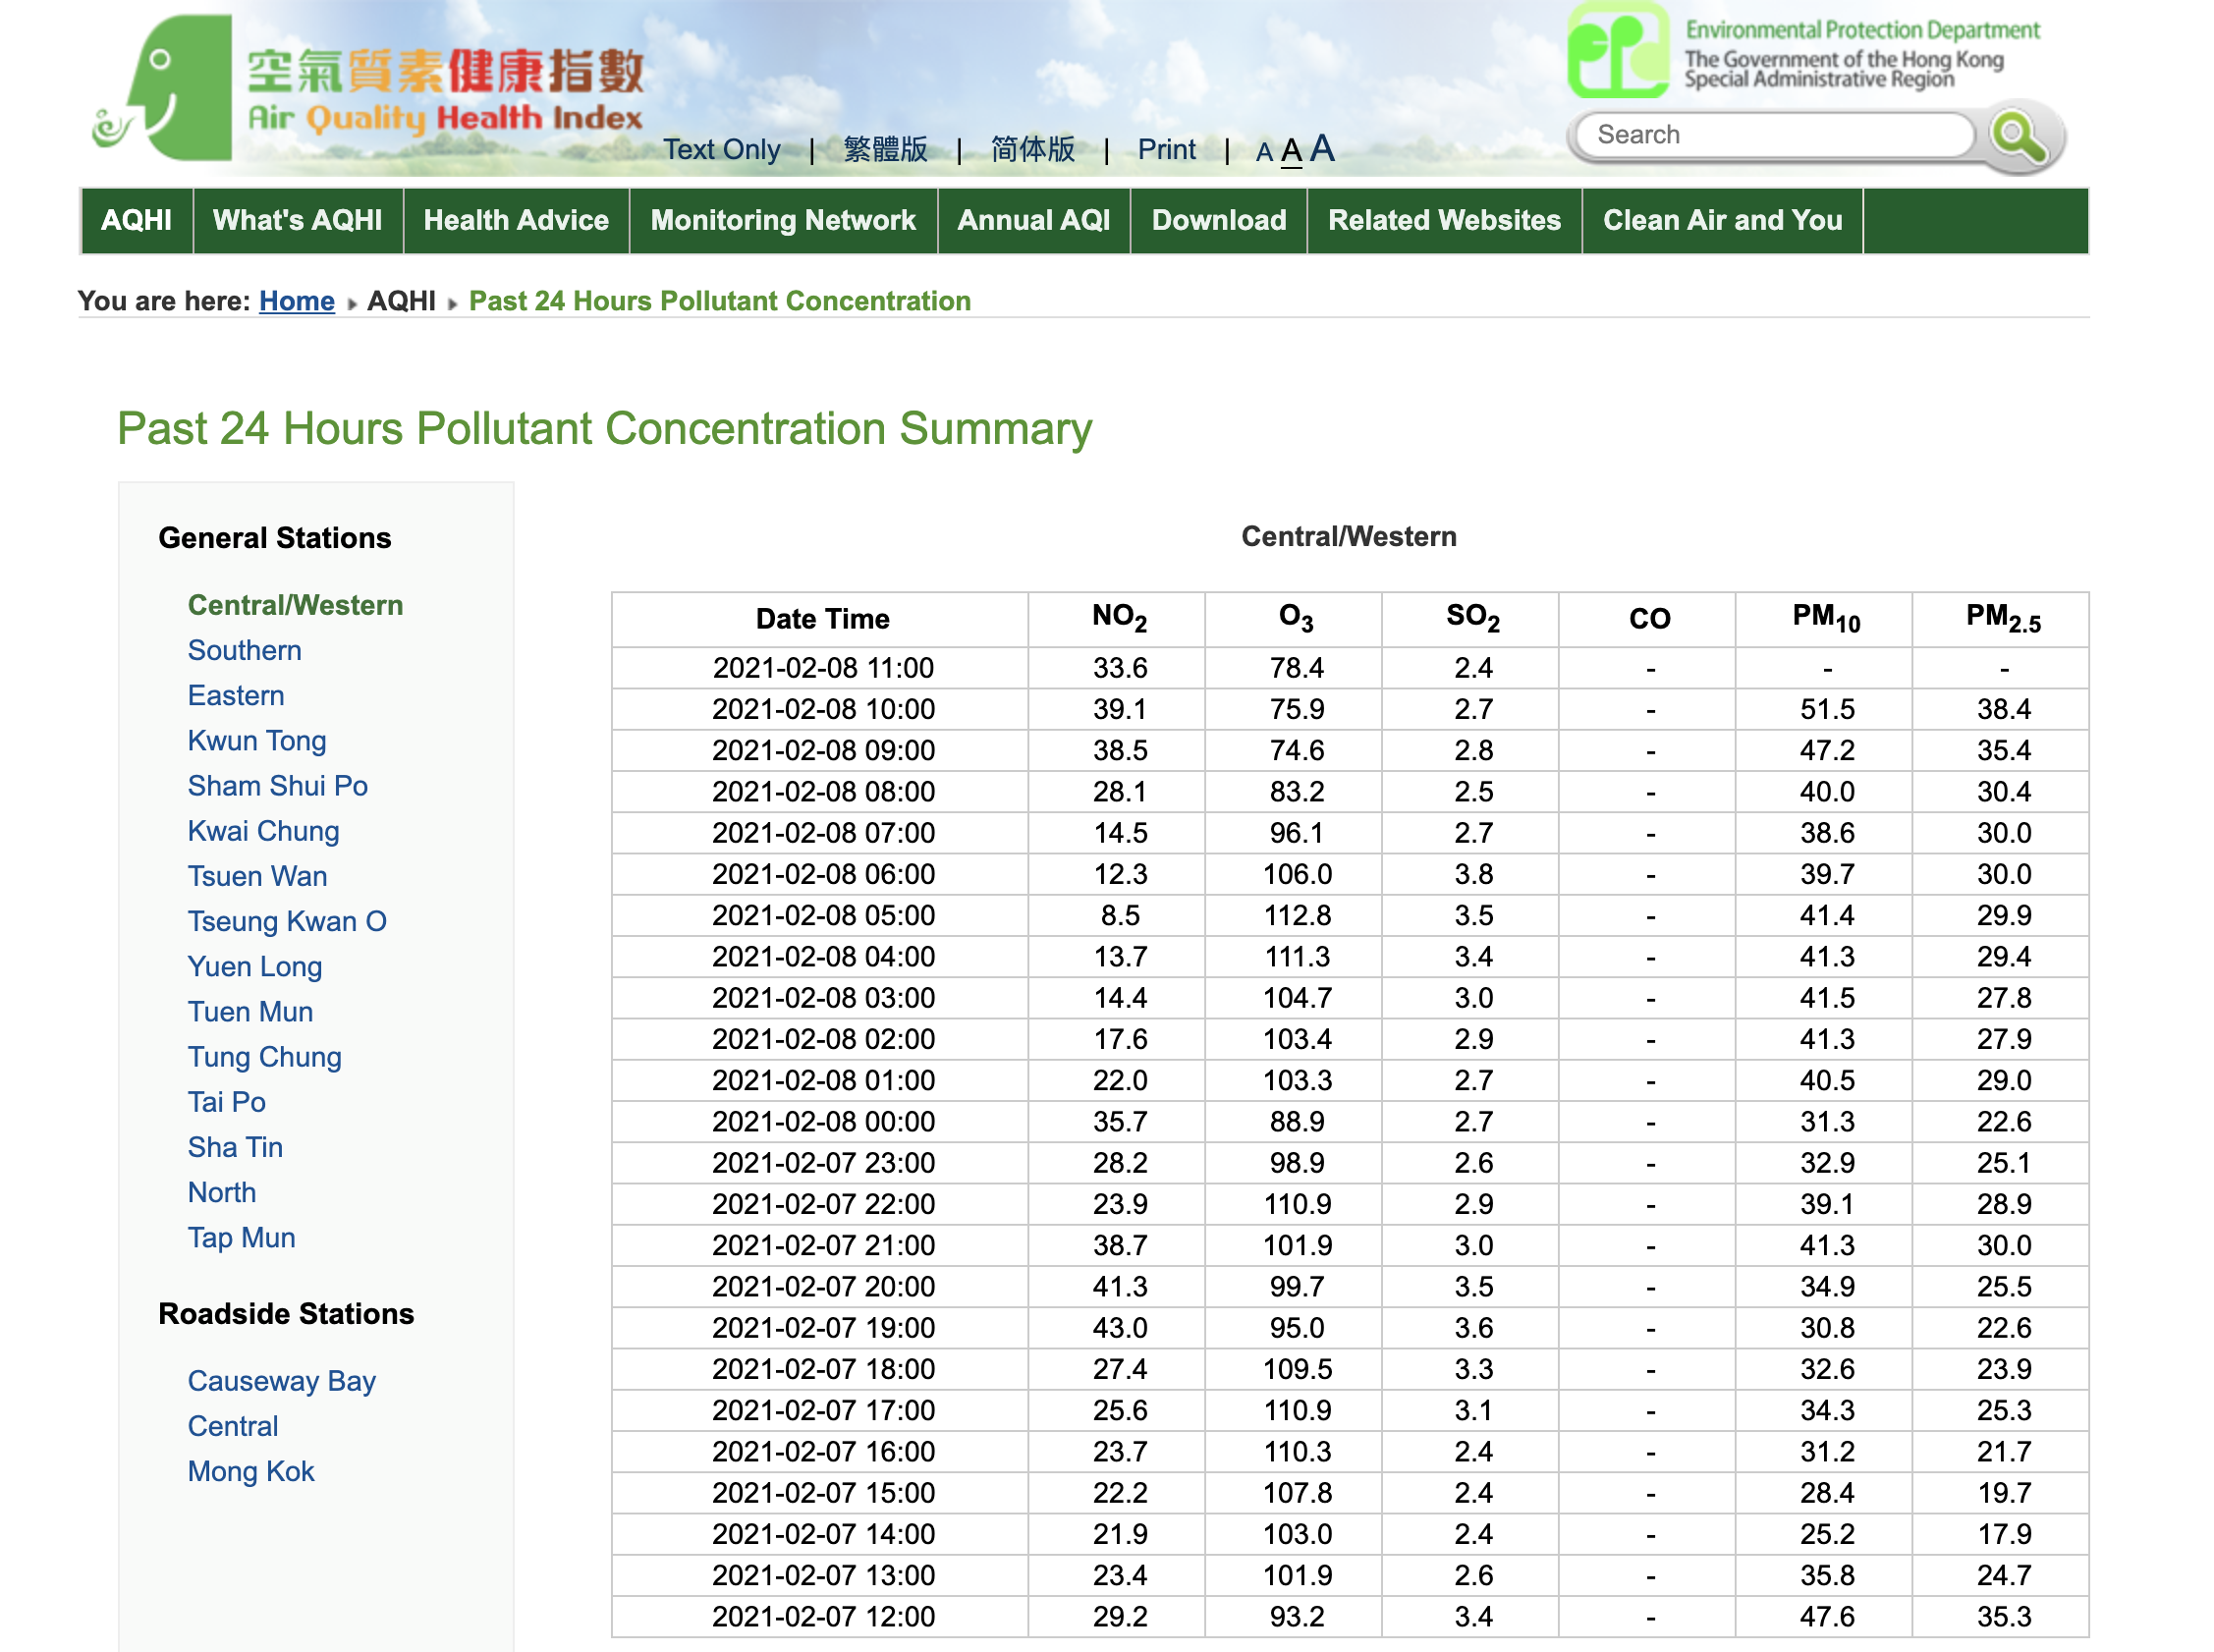
Go to the following web site to view the “Past 24 hour” air pollution data of Hong Kong.
https://www.aqhi.gov.hk/en/aqhi/past-24-hours-pollutant-concentration.html
This is a web site maintained by the Environmental Protection Department of Hong Kong on pollution of 18 districts.
The Data
Kwun Tong Air Pollutant Concentration on 9th December 2020
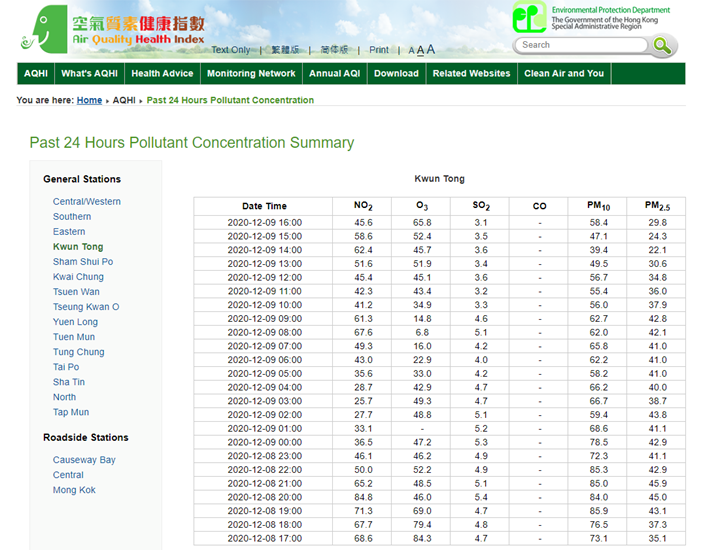
Web Link: https://www.aqhi.gov.hk/en/aqhi/past-24-hours-pollutant-concentration.html
Feel free to click on any district names on the left column to get the data at that district. Of course, the web address once you click the left column will change. For instance, if you click the name Kwun Tong, you will be directed to the unique web page.
Kwun Tong:
https://www.aqhi.gov.hk/en/aqhi/past-24-hours-pollutant-concentrationfb71.html?stationid=74
Similarly, click at the other districts to look at other data.
Tseung Kwan O:
https://www.aqhi.gov.hk/en/aqhi/past-24-hours-pollutant-concentration0b35.html?stationid=83
Notice that the difference in address between that of Kwun Tong and Tseung Kwan O are just the 2 sets of numbers. The number after the word “concentration” and before “.html” being the first difference, and the number after the “stationed=”
Problem We try to Solve
Can we automatically load the data of ALL 18 districts into a spreadsheet?
While the web site shows the pollution data in all 18 districts, it is very tiring to manually copy and paste the data onto a spreadsheet which will then allow us to do further analysis — — or even automatically notify us if there is any issue.
Yes, we can, and that is a technique called “Web Crawling”. In this section, we can get a taste of the power of this kind of technique. Let’s try it first and then we will explain.
Steps:
1. Open a Google Spreadsheet on your web browser. (Note: You may need to register an account on Google, such as Gmail, to use this. It is free.)
2. Either type “Google Sheet” on your search engine or directly click: https://www.google.com/sheets/about/
3. Start a new sheet by clicking the “+ Blank Sheet” icon on the web browser. Because of prior usage, the other icons may look differently. (You can also try opening a new sheet by following the instruction in this video: https://www.youtube.com/watch?v=K_jaMn78o2I)
4. Remember that the web page which contains the data is, for Kwun Tong district,
https://www.aqhi.gov.hk/en/aqhi/past-24-hours-pollutant-concentrationfb71.html?stationid=74 (Or you can go from the web page and click Kwun Tong on the left column to get to this page.)
5. Now this is the exciting part, Google Sheet has built-in functions that allow users to do selective crawling of web data. On your new blank sheet, go to cell A1, then type
= =IMPORTHTML(“https://www.aqhi.gov.hk/en/aqhi/past-24-hours-pollutant-concentration45fd.html?stationid=80″, “table”)
Note: the syntax is =IMPORTHTML(“the web page address”, “table”)
The placement of the parentheses, comma, and quotation marks is very important. For more details, you can look at the help page from Google: https://support.google.com/docs/answer/3093339?hl=en
Another point to note is that this function assumes that the cells where data will be placed are blank. So, in this case, it assumes that adjacent 25 rolls and from column A to column G are blank.
6. You should see now in your sheet the full data like below.
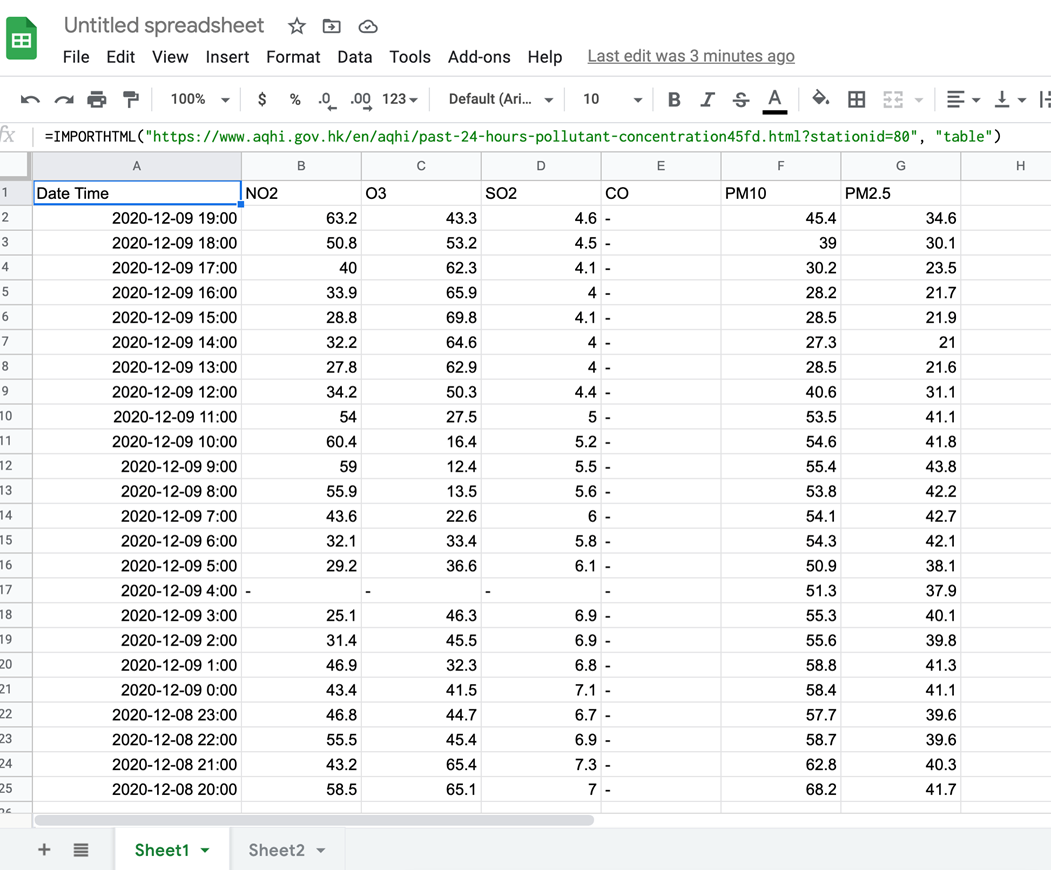
In the above, IMPORTHTML is a built in function allowing the Google Sheet to talk to most web pages. The first parameter is the web address of the page which you try to crawl. The second parameter “table” just means you want Google Sheet to download the table which appears in the web page.
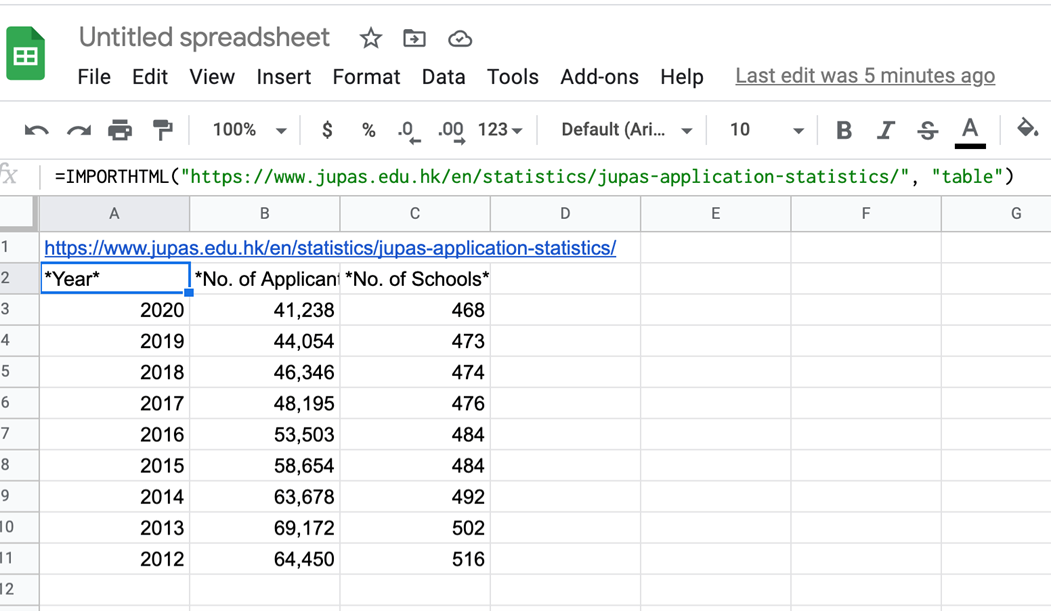
Additional Exercise (Some More Fun): Try something fun. Let’s grab the table from JUPAS (Hong Kong’s Joint University Program Admissions System) on admission statistics.
JUPAS publishes the admission statistics at https://www.jupas.edu.hk/en/statistics/jupas-application-statistics/
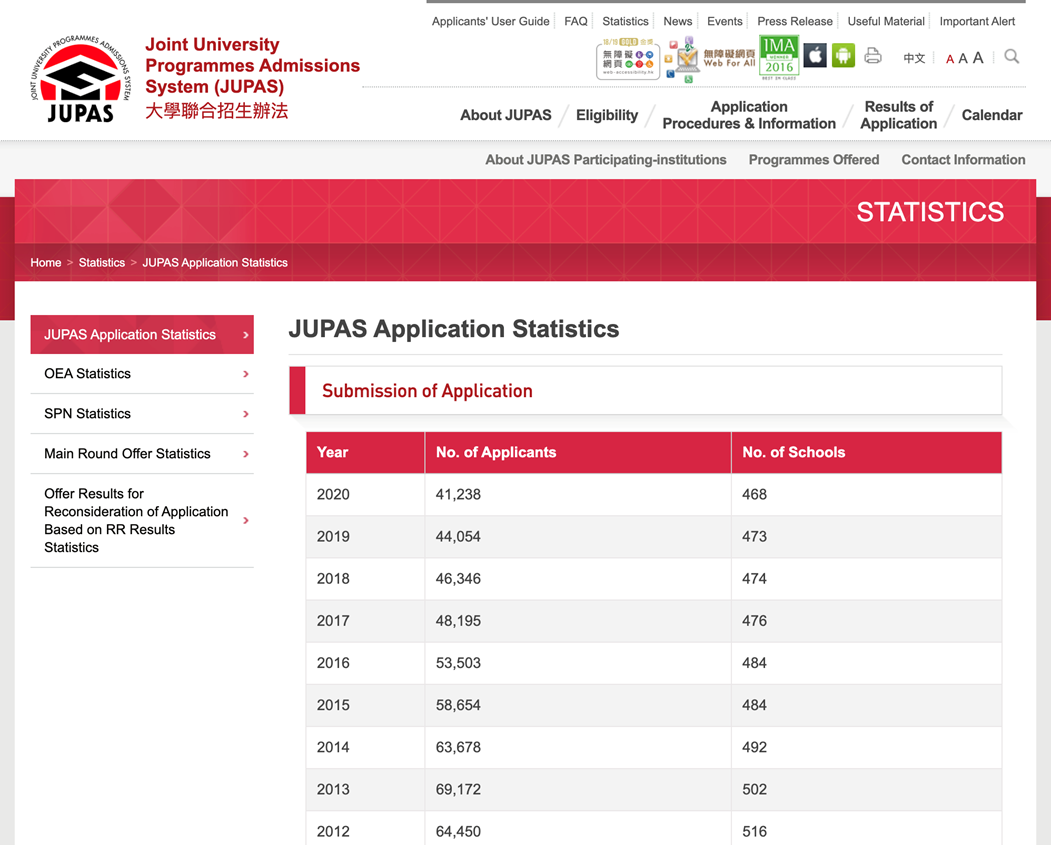
· Open a new sheet (make sure there is nothing else on the sheet), and type in cell A1: =IMPORTHTML(“https://www.jupas.edu.hk/en/statistics/jupas-application-statistics/”, “table”)
· And, you should see:
A simple step by step guide titled “如何自動同步過去24小時的空氣質素(Hong Kong Air Quality Health Index)數據,由香港政府網站到您的Google Sheet — — 超級簡單的方法”
is posted on YouTube at https://youtu.be/yRpLqlOMLnc